
Auto Stop: Carpooling Application
OUR PROJECTSAuto Stop: Carpooling Application DIDACSOFT developed for Auto Stop an intelligent carpooling application designed to simplify travel, connect drivers ...
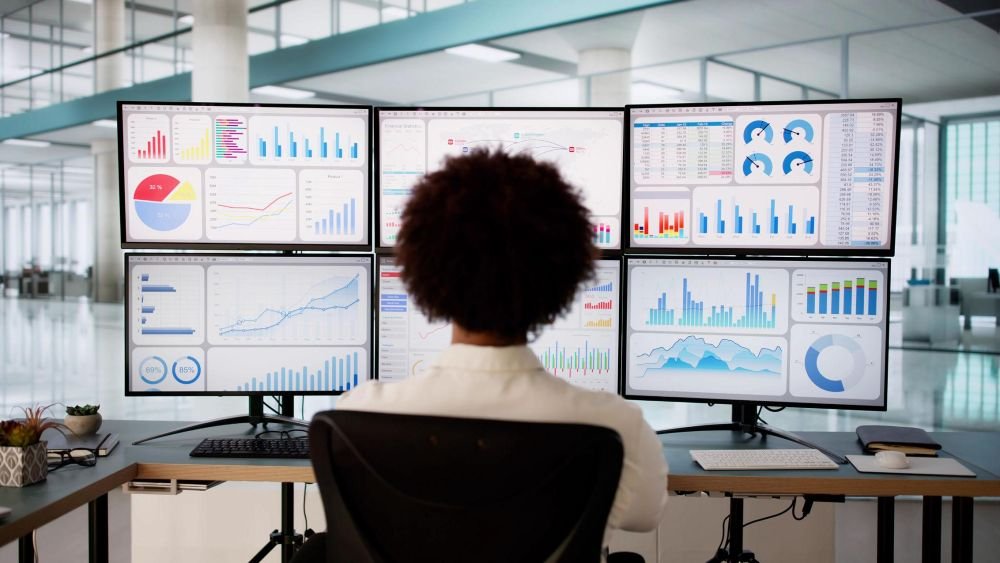
Home » Our Expertise » Dashboards & Reporting Solutions


We analyze your current dashboards, reporting habits, tools, and indicators in order to identify redundancies, inconsistencies, and improvement opportunities.
We help you identify the indicators that truly matter for your teams, based on your objectives, business priorities, and operational needs.
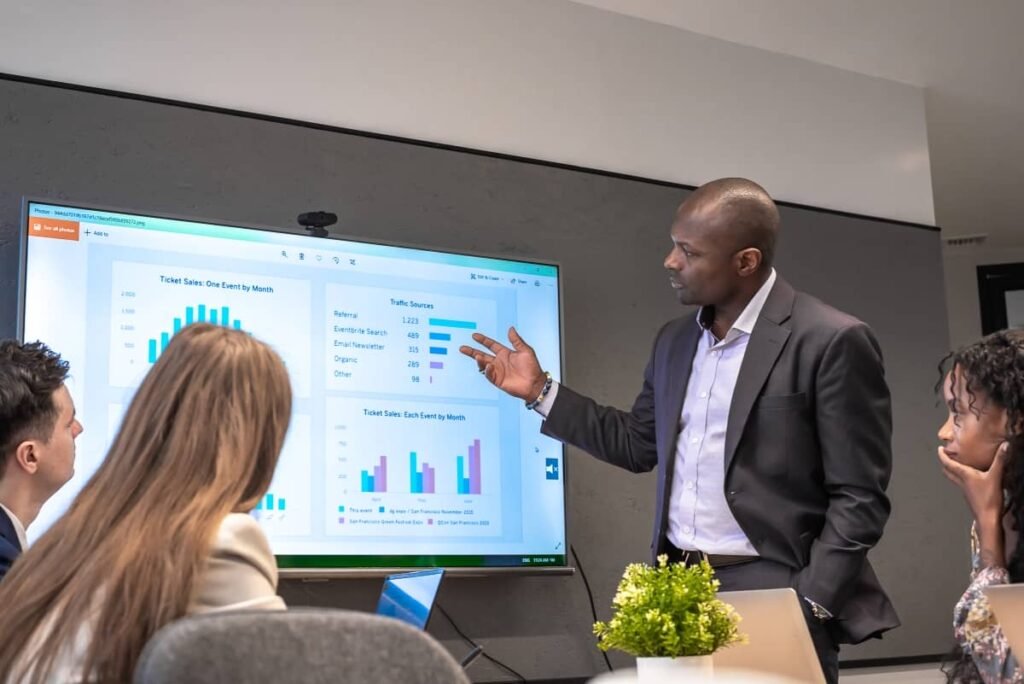
We design dashboards tailored to your management, finance, sales, marketing, operations, HR, or project monitoring challenges.
We connect your ERP, CRM, analytics tools, Excel files, SQL databases, APIs, and other applications to create a single source of truth.

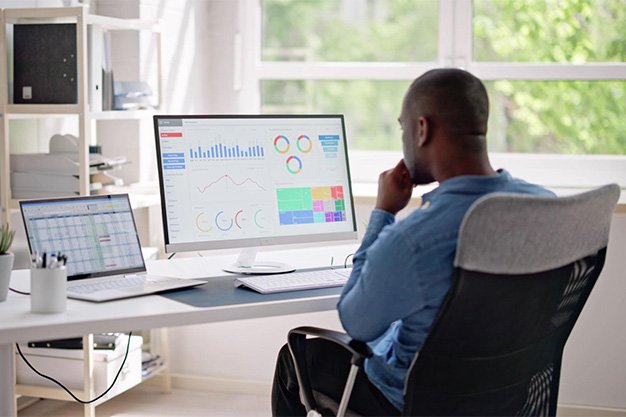
We design clear, readable, and decision-oriented interfaces so that each indicator can be understood in just a few seconds.
We automate the updating, generation, and distribution of your reports in order to reduce manual processing and improve information reliability.
We structure governed access to data so your teams can independently explore useful insights while maintaining consistent and validated metrics.
We implement access controls, traceability, security measures, and governance rules required to protect data and ensure reliable usage.
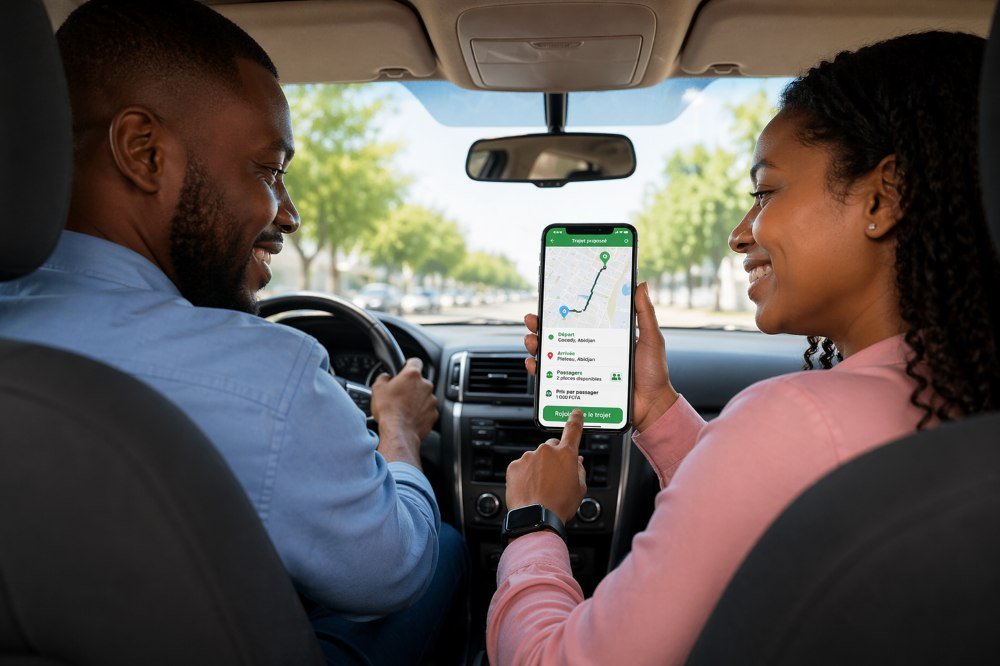
OUR PROJECTSAuto Stop: Carpooling Application DIDACSOFT developed for Auto Stop an intelligent carpooling application designed to simplify travel, connect drivers ...
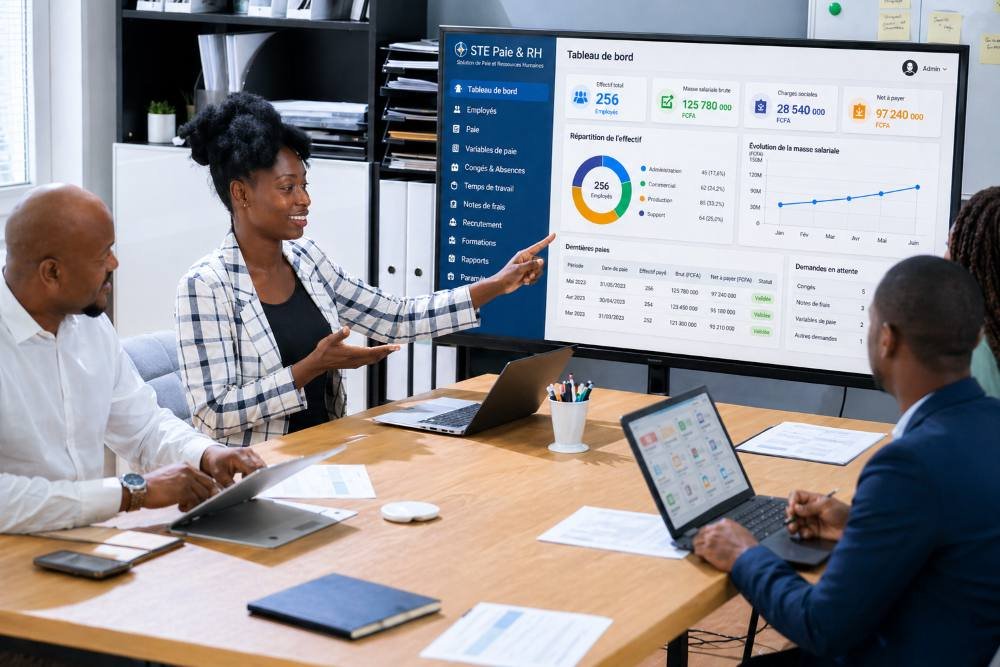
OUR PROJECTSLOGESCO HR PAY Chadian Water Company DIDACSOFT supported the Chadian Water Company in modernizing, automating, and securing its payroll ...

OUR PROJECTSPayroll and HR Management Solution for ANSICE – Chad In 2021, DIDACSOFT supported ANSICE in modernizing its payroll and ...
OUR PROJECTSENZO: Enterprise Management ERP DIDACSOFT designed for ID TELECOM SA a comprehensive software solution called ENZO 2.0, aimed at ...
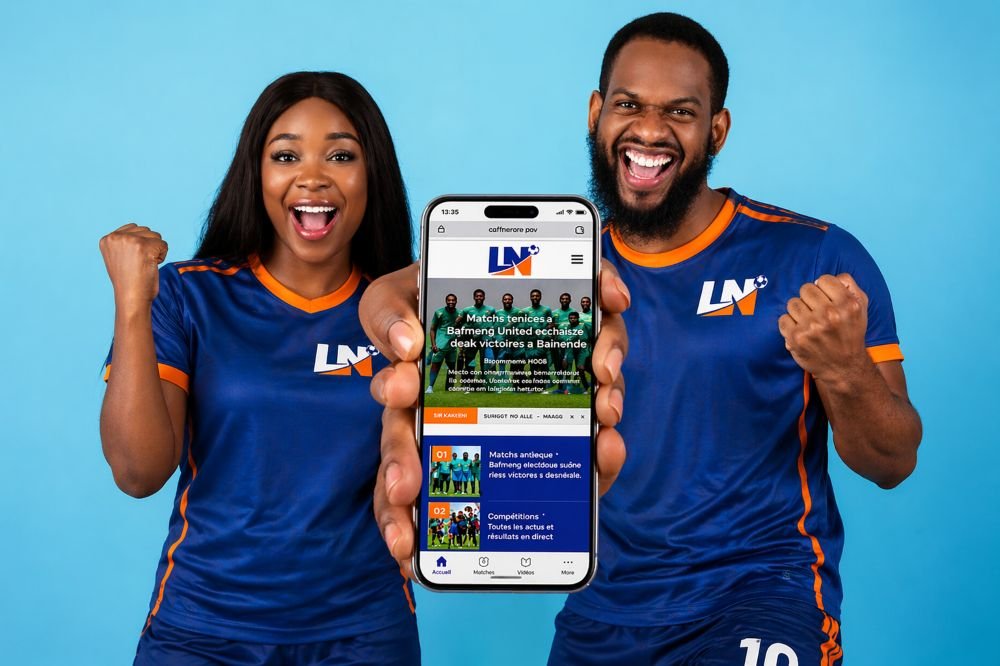
OUR PROJECTSLNFOOT Mobile Application DIDACSOFT developed an innovative mobile application for LNFoot dedicated to sports news and the promotion of ...

OUR PROJECTS Chrisma: Mobile Application DIDACSOFT developed for Chrisma a mobile e-commerce application dedicated to furniture sales and delivery, providing ...
Our dashboard & reporting expertise is designed for organizations that want to structure their management processes, improve the reliability of their indicators, and gain a clear, accessible, and actionable view of their performance.
A good dashboard highlights the right KPIs, in the right order, with a level of readability adapted to its users and the ability to take quick action based on the displayed data.
Yes. ERP, CRM, Excel, SQL databases, APIs, analytics platforms, and business tools can all be connected into a consolidated environment. This is one of the major strengths of modern dashboarding.
Yes. Executive teams, finance, marketing, sales, or operations departments do not need to see exactly the same indicators or the same level of detail.
Yes, to a large extent. Data updates, consolidations, and report distributions can be automated in order to significantly reduce manual processing and the risk of errors.
No, not necessarily. A good dashboard should be accessible to non-technical users, provided it is well designed and supported with proper onboarding and guidance.
No. Organizations also need reliable data quality, consistent KPIs, clear governance, and strong adoption by teams in order to truly become data-driven.
 English